Mireia Calvo (1), Jean-Luc Bonnet (2), Virginie Le Rolle (1), Maxime Lemonnier (2), Shota Yasuda (3), Wouter Oosterlinck (3), Alfredo Hern´andez (1)
(1) Univ Rennes, Inserm, LTSI – UMR 1099, Rennes, France
(2) Cairdac, Antony, France
(3) Katholieke Universiteit Leuven, Leuven, Belgium
ABSTRACT
Implantable accelerometers have been already pro-posed for the continuous monitoring of heart wall motion. Although a number of markers extracted from cardiac accelerometry have been associated with contractility, they are mainly based on uniaxial (1D) sensors, that not always reflect this relationship consistently. In this work, 3D-acceleration signals obtained from sensors located at the left ventricle (LV) of two anesthetized pigs were acquired at baseline and during dobutamine infusion, along with LV pressure. For each cardiac cycle, the reference contractility was estimated as the maximal LV pressure first derivative (dP/dtmax). The peak of maximum energy (PE) and the peak of acceleration (PA) were computed for each accelerometry axis and for the acceleration modulus. Different polynomial curves were fitted to scatterplots representing dP/dtmax vs. each extracted feature, in order to quantify fitting qualities. Three-dimensional features, and particularly PE, seemed to better represent contractility. Based on results, inotropism seems to be quadratically re-lated to acceleration-based features, which may lead to more reliable LV contractility estimates when based on 3D data.
INTRODUCTION
Implantable cardiac accelerometers have already been proposed for the characterization and monitoring of heart wall motion [1–5]. These small-size, inexpensive sensors are commonly based on piezoelectric materials capable of capturing dynamic changes in cardiac movement, allowing for the assessment of the mechanical cardiac function [6–10].
Previous studies have demonstrated the feasibility of epicardially implanted accelerometers in providing accu-rate estimations of myocardial ischaemia, comparable to conventional echocardiography, during regional left ventricular (LV) dysfunction induced by temporary coronary artery occlusion [8, 9, 11, 12]. However, most previous works are based on accelerometers implanted under open-chest conditions. Since sternotomy and pericardiotomy have been reported to significantly affect cardiac motion and inotropism [13,14], most recent studies are focused on the analysis of acceleration signals acquired under closed-chest conditions [15].
Cardiac accelerometry has been previously associated with inotropism [16–19], frequently inducing contractility variations through the application of pharmacologi-cal agents, such as dobutamine [15, 20]. Intracardiac accelerometry signal analysis has also been applied in humans, for instance, for the intraoperative optimization of cardiac resynchronization therapy [3]. However, although robust methods have been proposed to optimize the processing of these cardiac acceleration signals [2], previously analyzed markers are mainly based on uniaxial (1D) sen-sors, that are not able to capture the complex cardiac mechanical activity in a consistent manner.
In this work, we estimated several acceleration-based markers extracted from the LV free wall of two anesthesized pigs during the infusion of dobutamine; in order to evaluate their relationship with contractility and to analyze whether three-dimensional features may provide more ac-curate LV contractility estimations.
METHODS
1. Experimental protocol
Available data were acquired from an exploratory study conducted at the Hospital University of Leuven (KU Leuven), where accelerometer sensors were located at the LV free wall of two healthy pigs, anesthetized and ventilated at 15 breaths per minute, while inotropism variations were induced by the infusion of dobutamine (5 µg/kg/min). More specifically, by increasing contracility through the direct 58.0±2.8 kg and were 18.7±2.3 weeks old. The anesthesia was induced by means of zoletil (8 mg/kg) and xylazine (2.5 mg/kg) injection and anesthesia was maintained by in-fusion of propofol (10 mg/kg/u). Moreover, fentanyl (20 µg/kg/u) was administered for pain control. The surface ECG, peripheral pressure and oxygen saturation (SaO2) were continuously monitored throughout the procedure.
Signals were acquired by means of the PowerLab 16/35 (ADInstruments) system at a sampling frequency of 1 kHz. For this study, the surface ECG, the left ventricular pressure (LVP) recorded through the 5F cathetermicromanometer SPR-350 (Millar Instruments), and the 3D-accelerometry signals from LSM9DS1TR sensors (ST Microelectronics), encapsulated in epoxy forming a patch, implanted at the left ventricle (LV) were analyzed. More specifically, accelerometers were contained into an epoxy-coated patch, ligated on the epicardium of the LV free wall.
2. Feature extraction
From ECG recordings, R-wave peaks were detected through an algorithm based on the low-pass filtered ab-solute ECG derivate, in which a threshold identifies a time window locating the QRS complex and, thus, R-wave peaks.
After performing manual corrections when necessary, for each detected cardiac cycle, contractility was estimated as the maximal LV pressure first derivative (dP/dtmax). Similarly, the peak of maximum energy (PE), estimated using the periodogram method, and the peak of acceleration (PA) were acquired for each accelerometry axis and for the modulus, defined as:

Where AccX, AccY and AccZ account for the acceleration, expressed in g, registered at each accelerometry axis, after the application of a 4th-order Butterworth high-pass filter at 1 Hz, in order to remove DC offset.
3. Curve-fitting comparison
First (n =1) and second (n =2) order polynomial curves were fitted to the scatterplots representing the relationships between dP/dtmax and each extracted feature. The fitting quality of these curves to experimental data was finally quantified by the R-squared statistic measure, noted as R2.
RESULTS
Table 1 summarizes the R2 values obtained for all fitted curves. On average, second-order curves better reflected the dependency between acceleration-based features and dP/dtmax, indicating a quadratic relationship between contractility and cardiac acceleration.
Table 1. R2 from first (n=1) and second (n=2) or-der fitted curves, for all analyzed relationships between acceleration-based features and dP/dtmax. AccX, AccY , AccZ and AccM account for the acceleration signal used to calculate PE, defined as the peak of energy, and PA, as the peak of acceleration.

Second-order R2 were increased, on average, by 11%when the three accelerometry axes (AccM) were analyzed.
Thus, regarding second-order analysis, while similar results were obtained for both unidimensional markers, PE seemed to better represent contractility when based on 3D data.
Figures 1 and 2 show the time-varying dP/dtmax, together with the estimated PE from three-dimensional acceleration (PEAccM ), for both animals under study. More-over, the relationship between these features is also represented for each animal, as well as the second-order fitted curves and the associated R2 values.
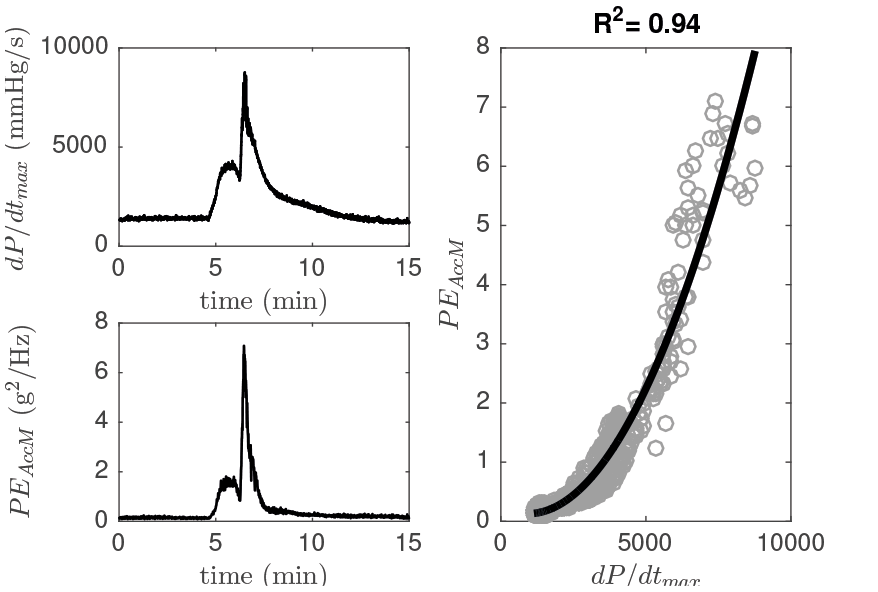
Figure 1. dP/dtmax, estimated three-dimensional energy (PEAccM ) and scatterplot associated, during the pharmacological test of Animal 1. Moreover, the fitted second-order curve and its R2 are provided.
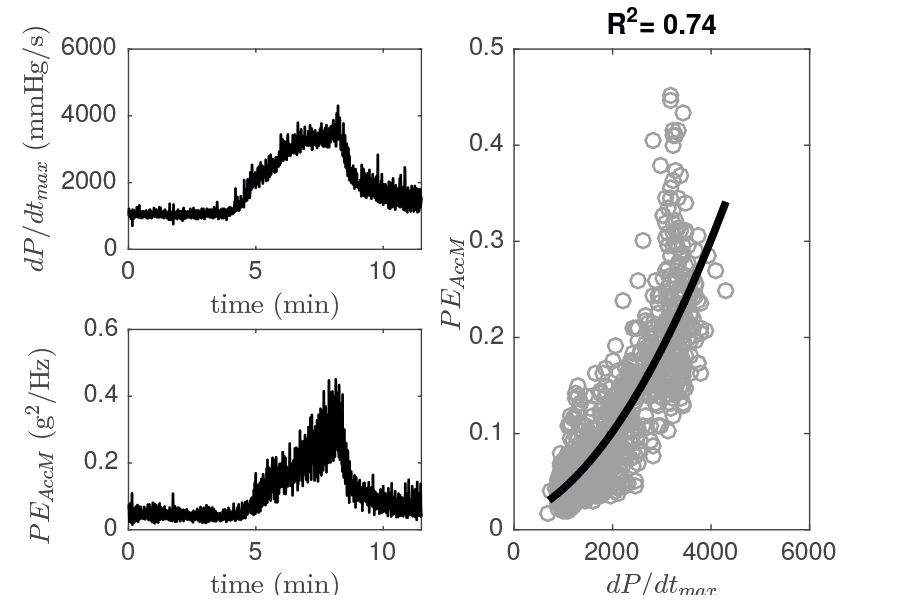
Figure 2. dP/dtmax, estimated three-dimensional energy (PEAccM ) and scatterplot associated, during the pharmacological test of Animal 2. Moreover, the fitted second-order curve and its R2 are provided.
A quadratic relationship between contractility and the energy captured by 3D-accelerometry can be observed in both figures. Although an excellent fitting quality is dis-played for animal 1, Figure 2 shows a moderate R2 result, mainly associated with an increased PE variability.
It can be noted from Table 1 that the use of three acceleration axes seems to improve results in cases of high-variability data, such as those coming from Animal 2. While uniaxial PE for this animal led to results between 0.5-0.6, when the three axes were taken into account, R2 increased up to 0.74. Regarding PA, uniaxial results showed high variability and an extremely low value for the z-axis and, although the use of information contained in the three axes tended to compensate this variability, PAAccM also led to a poor result.
Thus, in order to reduce this variability and propose more robust acceleration-based features capable of predict-ing cardiac contractility, the effect of applying a 5-sample moving average filter to these features was analyzed.
Table 2 summarizes the R2 values obtained for second-order polynomial curves fitted to filtered features.
Table 2. R2 from second-order fitted curves, for all analyzed relationships between filtered features (PE*, PA*) and dP/dtmax.
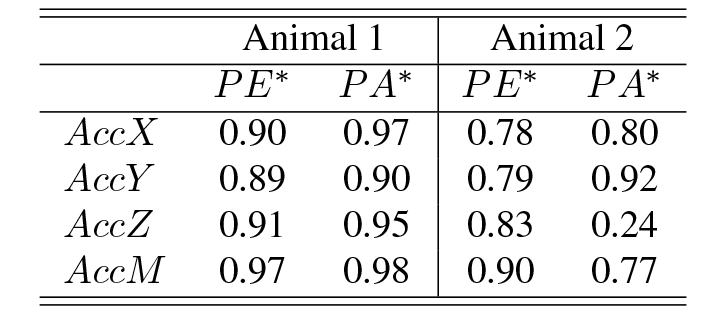
Although R2 values globally improved, general tendencies were maintained and, thus, PE measured from the 3D-acceleration information led to the best results. Figure 3 shows the scatterplots and fitted curves for both animals, when dP/dtmax was compared to the filtered peak of energy (PE*).
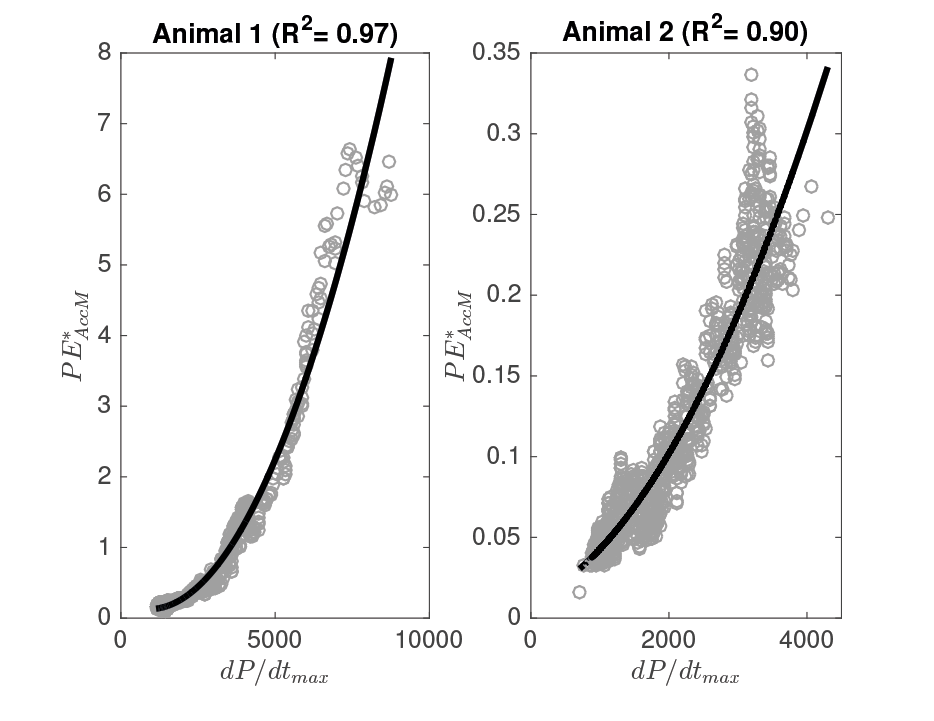
Figure 3. Scatterplot for the dP/dtmax vs. PE*AccM of both animals, together with the fitted second-order curves and assocaited R2 values.
In both cases, a quadratic relationship between contractility and the filtered peak of maximum energy mea-sured from the 3D-acceleration signal is clearly observed
(R2 0.9). However, a non-negligible inter-animal variability can be noted in PE values.
CONCLUSION
In this work, the relationship between LV contractility, captured by LV dP/dtmax, and different features extracted from the three-dimensional accelerometry signals, acquired from the LV free wall of two anesthesized pigs, was analyzed.
Although most previous works are based on uniaxial markers to estimate inotropism, this study shows that 3D-based features seem to more consistently represent cardiac contractility. More specifically, contractility seems to be quadratically related to three-dimensional acceleration-based features. Moreover, the maximum energy (PE) at each cardiac cycle is proposed as a marker of this contractility, showing good fits with data obtained during pharmacological inotropic stimulation. The application of a smoothing filter to extracted features further improved results by reducing the effects of high-variability data on fit-ting quality.
Although the obtained results should be validated in the future with larger databases, this work indicates trends of clinical relevance and provides further evidence for the role of three-dimensional accelerometry in providing more reliable LV contractility estimates.
REFERENCES
[1] Donal E, Giorgis L, Cazeau S, Leclercq C, Senhadji L, Am-blard A, Jauvert G, Burban M, Hern´andez AI, Mabo P. Endocardial acceleration (sonR) vs. ultrasound-derived time intervals in recipients of cardiac resynchronization therapy systems. Europace 2011;13:402-408.
[2] Giorgis L, Frogerais P, Amblard A, Donal E, Mabo P, Sen-hadji L,
Hern´andez AI. Optimal algorithm switching for the estimation of systole period from cardiac microacceleration signals (SonR). IEEE Transactions Biomedical Engineering 2012;59:3009-3015.
[3] Hern´andez AI, Ziglio F, Amblard A, Senhadji L, Leclercq
C. Analysis of endocardial acceleration during intraoperative optimization of cardiac resynchronization therapy. In 35th Annual International Conference of the IEEE Engineering in Medicine and Biology Society, 2013:7000-7003.
[4] Brancato L, Weydts T, De Clercq H, Dimiaux T, Herijgers P, Puers R. Biocompatible packaging and testing of an en-docardial accelerometer for heart wall motion analysis. Procedia Engineering 2015;120;840-844.
[5] Brancato L, Weydts T, Oosterlinck W, Herijgers P, Puers R. Packaging of implantable accelerometers to monitor epicardial and endocardial wall motion. Biomedical Microdevices 2017;19(3):52.
[6] Hoff L, Elle OJ, Grimnes MJ, Halvorsen S, Alker HJ, Fosse
E. Measurements of heart motion using accelerometers. In 26th Annual International Conference of the IEEE Engineering in Medicine and Biology Society, 2004:2049-2051.
[7] Elle OJ, Halvorsen S, Gulbrandsen MG, Aurdal L, Bakken A, Samset E, Dugstad H, Fosse E. Early recognition of regional cardiac ischemia using a 3-axis accelerometer sen-sor. Physiological Measurement 2005;26(4):429-440.
[8] Halvorsen PS, Espinoza A, Fleischer LA, Elle OJ, Hoff L, Lundblad R, Skulstad H, Edvardsen T, Ihlen H, Fosse
E. Feasibility of a three-axis epicardial accelerometer in detecting myocardial ischemia in cardiac surgical patients. The Journal of Thoracic and Cardiovascular Surgery 2008;136(6):1496-1502.
[9] Halvorsen PS, Fleischer LA, Espinoza A, Elle OJ, Hoff L, Skulstad H, edvardsen T, Fosse E. Detection of myocardial ischaemia by epicardial accelerometers in the pig. British Journal of Anaesthesia 2008;102(1):29-37.
[10] Remme EW, Hoff L, Halvorsen PS, Naerum E, Skulstad H, Fleischer LA, Elle OJ, Fosse E. Validation of cardiac accelerometer sensor measurements. Physiological Measurement 2009;30(12);1429-1444.
[11] Halvorsen PS, Remme EW, Espinoza A, Hoff L, Skulstad H, Edvardsen T, Fosse E. Automatic real-time detection of myocardial ischemia by epicardial accelerometer. The Journal of Thoracic and Cardiovascular Surgery 2010;139(4):1026-1032.
[12] Hyler S, Espinoza A, Skulstad H, Fosse E, Halvorsen PS. Left ventricular function can be continuously monitored with an epicardially attached accelerometer sensor. Euro-pean Journal of Cardio-Thoracic Surgery 2014;46(2):313-320.
[13] Skulstad H, Andersen K, Edvardsen T, Rein KA, Tonnessen TI, Hol PK, Fosse E, Ihlen H. Detection of ischemia and new insight into left ventricular physiology by strain Doppler and tissue velocity imaging: assessment during coronary bypass operation of the beating heart. Journal of the American Society of Echocardiography 2004;17(12):1225-1233.
[14] Smiseth OA, Scott-Douglas NW, Thompson CR, Smith ER, Tyberg JV. Nonuniformity of pericardial surface pressure in dogs. Circulation 1987;75(6):1229-1236.
[15] Grymyr OJ, Nguyen AT, Tjulkins F, Espinoza A, Remme EW, Skulstad H, Fosse E, Imenes K, Halvorsen PS. Continuous monitoring of cardiac function by 3-dimensional accelerometers in a closed-chest pig model. Interactive Car-diovascular and Thoracic Surgery2015;21(5):573-582.
[16] Bongiorni MG, Soldati E, Arena G, Quirino G, Vernazza F, Bernasconi A, Garberoglio B. Is local myocardial contractility related to endocardial acceleration signals detected by a transvenous pacing lead? Pacing and Clinical Electro-physiology 1996;19(11):1682-1688.
[17] Rickards AF, Bombardini T, Corbucci G, Plicchi G. Multi-center PEA Study Group. An implantable intracardiac accelerometer for monitoring myocardial contractility. Pacing and Clinical Electrophysiology 1996;19(12):2066-2071.
[18] Vogel M, Schmidt MR, Kristiansen SB, Cheung M, White PA, Sorensen K, Redington AN. Validation of myocardial acceleration during isovolumic contraction as a novel non-invasive index of right ventricular contractility: comparison with ventricular pressure-volume relations in an animal model. Circulation 2002;105(14):1693-1699.
[19] Hashimoto I, Li XK, Bhat AH, Jones M, Sahn DJ. Quanti-tative assessment of regional peak myocardial acceleration during isovolumic contraction and relaxation times by tis-sue Doppler imaging. Heart 2005;91(6):811-816.
[20] Lyseggen E, Rabben SI, Skulstad H, Urheim S, Risoe C, Smiseth O. A. Myocardial acceleration during isovolumic contraction: relationship to contractility. Circulation 2005;111(11):1362-1369.
Address for correspondence:
A. HERNANDEZ
Univ Rennes, Inserm, LTSI – UMR 1099,
Campus de Beaulieu, Bat. 22, F-35042, Rennes, France alfredo.hernandez@univ-rennes1.fr
